Readers of this blog are not new to my ramblings on soft peer review, social metrics and post-publication impact measures:
- can we measure the impact of scientific research based on usage data from collaborative annotation systems, social bookmarking services and social media?
- should we expect major discrepancies between citation-based and readership-based impact measures?
- are online reference management systems more robust a data source to measure scholarly readership than traditional usage factors (e.g. downloads, clickthrough rates etc.)?
These are some of the questions addressed in my COOP ’08 paper. Jason Priem also discusses the prospects of what he calls “scientometrics 2.0″ in a recent First Monday article and it is really exciting to see a growing interest in these ideas from both the scientific and the STM publishing community.
We now need to think of ways of putting these ideas into practice. Science Online London 2010 earlier this month offered a great chance to test a real-world application of these ideas in front of a tech-friendly audience and this post is meant as its official announcement.
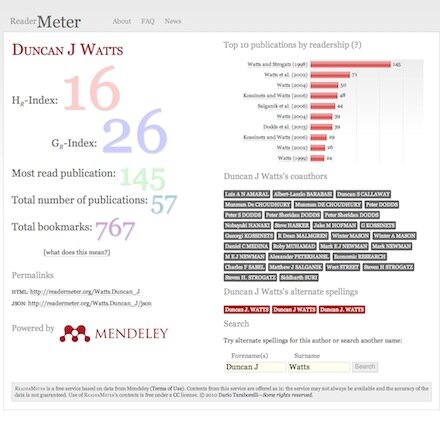
ReaderMeter is a proof-of-concept application showcasing the potential of readership data obtained from reference management tools. Following the announcement of the Mendeley API, I decided to see what could be built on top of the data exposed by Mendeley and the first idea was to write a mashup aggregating author-level readership statistics based on the number of bookmarks scored by each of one’s publications. ReaderMeter queries the data provider’s API for articles matching a given author string. It parses the response and generates a report with several metrics that attempt to quantify the relative impact of an author’s scientific production based on its consumption by a population of readers (in this case the 500K-strong Mendeley user base):

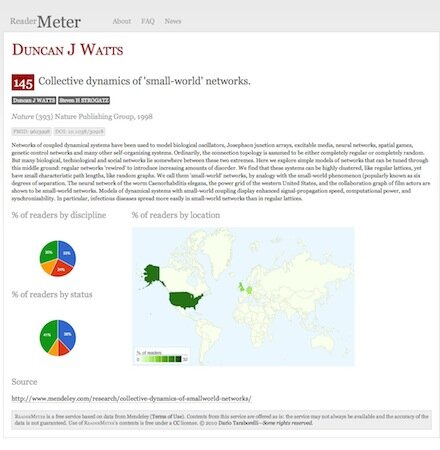
The figure above shows a screenshot of ReaderMeter’s results for social scientist Duncan J Watts, displaying global bookmark statistics, the breakdown of readers by publication as well as two indices (the HR index and the GR index) which I compute using bookmarks as a variable by analogy to the two popular citation-based metrics. Clicking on a reference allows you to drill down to display readership statistics for a given publication, including the scientific discipline, academic status and geographic location of readers of an individual document:

A handy permanent URL is generated to link to ReaderMeter’s author reports (using the scheme: [SURNAME].[FORENAME+INITIALS]), e.g.:
http://readermeter.org/Watts.Duncan_J
I also included a JSON interface to render statistics in a machine-readable format, e.g.:
http://readermeter.org/Watts.Duncan_J/json
Below is a sample of the JSON output:
{
        "author": "Duncan J Watts",
        "author_metrics":
        {
                "hr_index": "15",
                "gr_index": "26",
                "single_most_read": "140",
                "publication_count": "57",
                "bookmark_count": "760",
                "data_source": "mendeley"
        },
        "source": "http://readermeter.org/Watts.Duncan_J",
        "timestamp": "2010-09-02T15:41:08+01:00"
}
Despite being just a proof of concept (it was hacked in a couple of nights!), ReaderMeter attracted a number of early testers who gave a try to its first release. Its goal is not to redefine the concept of research impact as we know it, but to complement this notion with usage data from new sources and help identify aspects of impact that may go unnoticed when we only focus on traditional, citation-based metrics. Before a mature version of ReaderMeter is available for public consumption and for integration with other services, though, several issues will need to be addressed.
1. Author name normalisation
The first issue to be tackled is the fact the same individual author may be mentioned in a bibliographic record under a variety of spelling alternates: Rod Page was among the first to spot and extensively discuss this issue, which will hopefully be addressed in the next major upgrade (unless a provision to fix this problem is directly offered by Mendeley in a future upgrade of their API).
2. Article deduplication
A similar issue affects individual bibliographic entries, as noted by Egon Willighagen among others. Given that publication metadata in reference management services can be extracted by a variety of sources, the uniqueness of a bibliographic record is far from given. As a matter of fact, several instances of the same publication can show up as distinct items, with the result of generating flawed statistics when individual publications and their relative impact need to be considered (as is the case when calculating the H- and G-index). To what extent crowdsourced bibliographic databases (such as those of Mendeley, CiteULike, Zotero, Connotea, and similar distributed reference management tools) can tackle the problem of article duplication as effectively as manually curated bibliographic databases, is an interesting issue that sparked a heated debate (see this post by Duncan Hull and the ensuing discussion).
3. Author disambiguation
A way more challenging problem consists in disambiguating real homonyms. At the moment, ReaderMeter is unable to tell the difference between two authors with an identical name. Considering that surnames like Wang appear to be shared by about 100M people on the planet, the problem of how to disambiguate authors with a common surname is not something that can be easily sorted out by a consumer service such as ReaderMeter. Global initiatives with a broad institutional support such as the ORCID project are trying to fix this problem for good by introducing a unique author identifier system, but precisely because of their scale and ambitious goal they are unlikely to provide a viable solution in the short run.
4. Reader segmentation and selection biases
You may wonder: how genuine is data extracted from Mendeley as an indicator of an author’s actual readership? Calculating author impact metrics based on the user population of a specific service will always by definition result in skewed results due to different adoption rates by different scientific communities or demographic segments (e.g. by academic status, language, gender) within the same community. And how about readers who just don’t use any reference management tools? Björn Brembs posted some thoughtful considerations on why any such attempt at measuring impact based on the specific user population of a given platform/service is doomed to fail. His proposed solution, however – a universal outlet where all scientific content consumption should happen–sounds not only like an unlikely scenario, but also in many ways an undesirable one. Diversity is one of the key features of the open source ecosystem, for one, and as long as interoperability is achieved (witness the example of the OAI protocol and its multiple software implementation), there is certainly no need for a single service to monopolise the research community’s attention for projects such as ReaderMeter to be realistically implemented. The next step on ReaderMeter’s roadmap will be to integrate data from a variety of content providers (such as CiteULike or Bibsonomy) that provide free access to article readership information: although not the ultimate solution to the enormous problem of user segmentation, data integration from multiple sources should hopefully help reduce biases introduced by the population of a specific service.
What’s next
I will be working in the coming days on an upgrade to address some of the most urgent issues, in the meantime feel free to test ReaderMeter, send me your , follow the latest news on the project via or just help spread the word!


