A general model of productivity?
June 15th, 2009 by jamesI want to try something a bit different in this post. Here at AP.com, we’ve talked a lot about tools, theory, trends and the general ephemera of academic productivity. But writing as academics, we should probably be trying to take this experience and build it into a cohesive model of productivity. So my goal here is to suggest a general model, one that we might use to understand what we’ve learned from previous posts and hopefully apply to our own work.
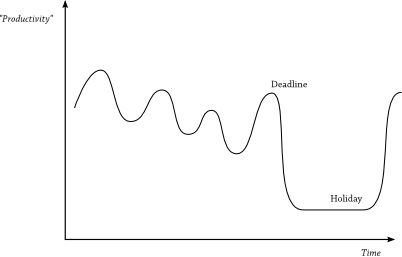
My starting point for this post was simple; I wanted to know how my productivity has changed (hopefully improved) since I first started my DPhil. From keeping a research journal, I know that some days are more productive than others and it would very helpful if I could understand when those fits and starts occur, to spot co-occuring events and thereby learn when to say “Forget work, I’m going for a run.”
In other words, I wanted to plot my productivity cycle over time. It might look something like this:
But the obvious problem with this exercise is how to measure productivity. It’s a subject that’s been tackled indirectly on this site before but going through the old posts, I haven’t yet find any attempts at a general theory – and related measures – of productivity. So drawing on the collected wisdom of previous AP.com posts, here’s a rough sketch of such a theory.
What is productivity?
Most simply, productivity is a question of efficiency: what outputs can be produced for a given amount of inputs? If you were working in a factory, measuring productivity is therefore fairly straight-forward: widgets per hour might be a nice personal productivity measure. But in an academic context, these inputs and outputs are not so easily defined.
This dilemma is briefly introduced in a discussion of productivity for programmers, where Gil Gordon suggests that when we say productivity, we really mean effectiveness. In other words, unlike a factory worker, our outputs can be multi-faceted and might be judged by their:
- Quantity (how much gets done)
- Quality (how well it gets done)
- Timeliness (when it gets done)
- Multiple priorities (how many things can be done at once)
Nevertheless the basic efficiency model is a good template for our model. So if P = productivity, O = output and I = input, we can write the basic definition:
![]()
Defining outputs
There are many different kinds of academic output. Papers, citations, funding received, teaching feedback, and promotions are just some of the ways in which we can measure our success, either directly or indirectly.
But as Jose pointed out previously, these outputs are all trying to attract a scarce resource, namely attention, and success in attracting attention results in prestige. So we might say that, for a given class of task t, output could be measured as:
![]()
where pt is the prestige associated with task t and nt is the number of those tasks completed in a given time period.
Measuring prestige varies with the task. For journal papers, citations seems like a sensible measure but for other tasks, this may involve a lot of guesswork. If your university has guidelines on promotion, they can be useful in identify how much of your professional success is expected to come from teaching, research and so on. But most likely you will need to use a technique like Analytic Hierarchy Process to unify your prestige measures.
Defining inputs
If you follow the game of cricket, you are probably familiar with the Duckworth-Lewis method. In an English summer, it often happens that one team has finished batting and their opponents have just started trying to catch the target score when it begins to rain. Rather than call off the whole game, the DL method is used to adjust the target score to account for a reduced amount of playing time. To do this, Messrs. Duckworth and Lewis developed their model using the concept of resources.
With productivity inputs, we can do something similar. The amount and quality of work that we can achieve depends on the resources available to us. But instead of wickets and overs in cricket, academic input resources might include time, money, lab access, the attention and effort we can devote to a task and so on.
Again, some of these inputs are more easily measured than others but if we want to generalize our model, we need some sort of conceptual common currency like we had with prestige on the output side. An economist might attempt to convert everything to money: how much would I have to spend to acquire this piece of data? But to link with our earlier discussion of prestige, I think a more useful framework is to convert everything to a common attention unit: let’s call it the Atnu for short (AU is already taken).
1 Atnu can be defined as the amount of attention necessary for a reference task, such as reading a journal article. It’s a rather arbitrary unit, but it’s intended to acknowledge that an hour of hard concentration is not the same as an hour spent doing miscellaneous administrative tasks like sorting through emails. It also has the advantage that you can define the Atnu as it makes sense to you and your work; if you spend time in a lab, performing an assay might be the base unit. My only suggestion would be that it is the defined as the most attention-consuming task. That way, the most difficult part of your day will correspond with actual hours.
So for task t, we can say that the total input is the total amount of attention hours spent on the job.
![]()
where at is the Atnu value for task t and ht is the actual number of hours spent working at that level.
Final notes
Putting it all together then, productivity is the amount of prestige we earn for each attention-hour we invest.
![]()
It is a very simple model but from the form of this equation, we can already draw a few practical conclusions (even if they just confirm what we intuitively knew already):
- Productivity is maximized by concentrating on those activities that earn you the most prestige for the least effort. Conveniently the form of the equation is linear so that, assuming not all of the variables are unknowns, you could apply linear programming techniques to come with fancy “optimal” productivity strategies.
- Since the number of hours in a day is fixed, and we can arguably only give our full attention to a fraction of these hours, we should try to improve productivity by reducing either the number of hours or the amount of attention that a task requires. Some strategies let you do both things at once. For example, co-authoring a paper means you can delegate some of the work to someone else; you only need to invest a reduced amount of attention-hours to manage the project but you’ll receive similar amounts of prestige. Case in point: the world’s best connected mathematician.
- For those tasks that you have to do yourself, use your time wisely. This means balancing the levels of attention required by different tasks so you don’t burn out and focusing on those that earn the most prestige. This is why so much of what we write about here is concerned with time management, especially those tools that help us finish necessary but unrewarding administrata. See this post in particular.
What about actually implementing the model?
- Fitting the model to data and standardizing the coefficients for a large population will be difficult. As covered in this interview with Dan Navarro, there are “some big individual differences” in how people work; we shouldn’t put too much hope on one model holding for everyone.
- The interview also touches on another related issue: uncertainty. A strict optimization strategy is probably impossible because you don’t know the prestige associated with a task a priori. As Dan says, “it’s striking the right balance between exploration [of new ideas] and exploitation [of existing work]“.
- A related implementation issue is the problem of timing when collecting productivity data. This is two-fold: 1) when does the prestige arrive relative to the task being completed and 2) what is the temporal resolution of the feedback? One task may yield many different types of “prestige”: a small immediate personal satisfaction for completing a paper, a medium term recognition as it is published in a journal and cited, and maybe 50 years later receiving the Nobel Prize for your work. More from the archives on this here.
- I’ve said nothing about the psychology of productivity. It seems to me there should be feedback and “versus expectation” terms in all of this. Our earlier posts on learning theory and managing large projects (1,2,3,4,5) discuss the need to set clear goals, evaluate your performance against targets, and to learn from these experiences, changing your habits for next time. Such evaluations are key to maintaining your motivation and productivity.
- I’ve also said nothing about the physiology of productivity. What is the role of diet, daylight hours and half a dozen other factors?
So there you go. My two cents on what all of this productivity stuff really boils down to. I’m curious to see what you the readers think. Is this a crazy idea? Should we be trying to model productivity in such a formal way? Does anyone have the appetite for a community effort to gather some data and test the theory out?
There’s a follow-up post available with data testing this model.

June 15th, 2009 at 7:32 pm
Killer post. Demonstrates that you can have a formal model (with equations) in a blog and that a post is not necessarily ‘soft reading material’. Lots of thought must have gone into this model. As simple as it is, I think it captures a lot of the action. Using attention and prestige (two key concepts we’ve proposed here at AP.com before) seems to be really useful.
I’m up for testing this. Empirically.
Does anyone know of any good software (maybe a website) to track this kind of data?
And, maybe the first step, let’s try to really pin down the value of an Atnu. Reading an article varies in effort (some are more difficult than others), but could be a good proxy since everyone in every discipline needs to do this.
Just thinking outloud…
June 16th, 2009 at 8:02 am
I admire you. I have never read before a so complex post about productivity with formulas and models. Great work James.
June 16th, 2009 at 8:36 am
Thanks for the feedback Jose.
I haven’t found any good tracking software yet (though I haven’t really looked either). It would need to be fairly robust though: I’m thinking of a database model where you can enter projects and track related inputs and outputs over time at 15 minute intervals (or less?). Perhaps I’ll try it next week, just with pen and paper and see where I get.
But yes, defining an Atnu seems like a good first step. I think this is a job for AHP too and so we’d need to start by building up a list of tasks that can be pairwise ranked for attention requirements. Again thinking out loud, some examples might include:
- Reviewing a journal article for journal x
- Sketching out the idea for a new journal article
- Preparing a journal quality figure
- Preparing for a one-hour lecture
If people can post these types of tasks as comments, then we can rig up a SurveyMonkey form or something to calculate some Atnu values.
June 16th, 2009 at 5:51 pm
Interesting post. What about using a notion similar to the physics notion of “work” as a measure of force per distance? The “work” performed on a task is equal to the difficulty of the task (amount of brain power, concentration, attention, exertion) times the amount of time that that effort is sustained. Then you can either attenuate or amplify this figure according to the usefulness of the task. For example, running 5km and reading a journal article are tasks of the same duration and intensity, but one is (academically) productive and the other is not.
June 16th, 2009 at 6:14 pm
Quick follow-up, the formula p = u / log(dt) seems to rank task productivity correctly (p is productivity, u is usefulness, d is difficulty and t is time). In my tests, difficulty and usefulness were ranked on a scale of 1-10 and time was in minutes. I am going to try this for a couple of days and see if the results make sense…
June 17th, 2009 at 4:56 pm
Thanks for pointing that out Benjamin. The idea of multiply the attention required by a task and the time it takes (the a*h denominator) is definitely similar to the physics notion of work — which maybe means we’re onto something.
It would be great to hear a bit more about your data collection and experiments too. I’m curious about the choice of the log function.
June 26th, 2009 at 1:40 pm
Here is a bit of data from three days of “work”… I am a Master’s student and am just starting to write my thesis, so my work consists of reading, writing, research, procrastination, etc.
Day 1
Task | Usefulness | Difficulty | Time | Productivity
Planning | 4 | 3 | 15 | 2.4
Trying prod. formulas | 2 | 4 | 120 | 0.7
Solved math question | 1 | 8 | 135 | 0.3
More on prod. formulas | 2 | 4 | 60 | 0.8
Installed soft. imported i | 5 | 4 | 90 | 2.0
TOTAL productivity = 6.3
avg. hourly productivity = 1.3
Day 2
Task | Usefulness | Difficulty | Time | Productivity
Planning | 4 | 2 | 15 | 2.7
Fixed comments, form. | 7 | 4 | 90 | 2.7
PDF settings LaTex | 4 | 3 | 45 | 1.9
Wasted time online | 2 | 1 | 45 | 1.2
Wasted more time | 1 | 2 | 30 | 0.6
Continued formulas | 7 | 4 | 150 | 2.5
Unaccounted time | 0 | 1 | 45 | 0
TOTAL productivity = 11.6
avg. hourly productivity = 1.7
Day 3
Task | Usefulness | Difficulty | Time | Productivity
Email for meeting | 7 | 4 | 30 | 3.4
Wasted time online | 1 | 1 | 30 | 0.7
Planning | 5 | 3 | 45 | 3.0
Fixed intro, objectives | 9 | 6 | 90 | 3.3
Found and read manual | 5 | 3 | 60 | 2.2
Played with some data | 5 | 4 | 60 | 2.1
Unaccounted time | 0 | 1 | 135 | 0
TOTAL productivity = 14.6
avg. hourly productivity = 2.1
When I look at these results, I agree with the way the formula ranks tasks and total productivity… You can also add a a task with 0 usefulness and difficulty of 1 that accounts for the rest of a workday (wasted time that is not accounted for in these tasks); this then allows you to compute your average hourly productivity for the day.
The choice of the log function is based on a few considerations. Without it, the value of productivity is a very small number, difficult to understand and compare. Also, putting work on a logarithmic scale reduces the influence of tasks that take a long time.
At the same difficulty and usefulness, a shorter task should be considered more productive. At equal usefulness and equal time, a less difficult task should be considered more productive. These rankings are only achieved if I use the log function.
Any thoughts on these results? Have you started collecting data?
June 26th, 2009 at 2:17 pm
Wow – that’s great Benjamin. I’ve started gathering some data and hope to post something in a week or two (I’m going to a conference next week which will mess up the data slightly).
Quick question: have you used any special techniques to assign the 1-10 scores for usefulness and difficulty or are they best guesses?
September 16th, 2009 at 6:47 pm
[...] One of the themes we’ve been discussing here is the idea that prestige and attention are the main currencies of academia. So it only makes sense that you want your online [...]
February 24th, 2010 at 11:49 pm
[...] measuring academic productivity, James Keirstead assembled a “general model of productivity,†following the standard “outputs per unit of input†formula. His units of measure suit [...]